The Signal / Methodology
Methodology
What a matcha, vintage loafers, and a tulip habit tell you about your top 15%.
Gary Little · 7 min read
Key finding
Every signal she gives off is data. The brand that reads all of them wins.
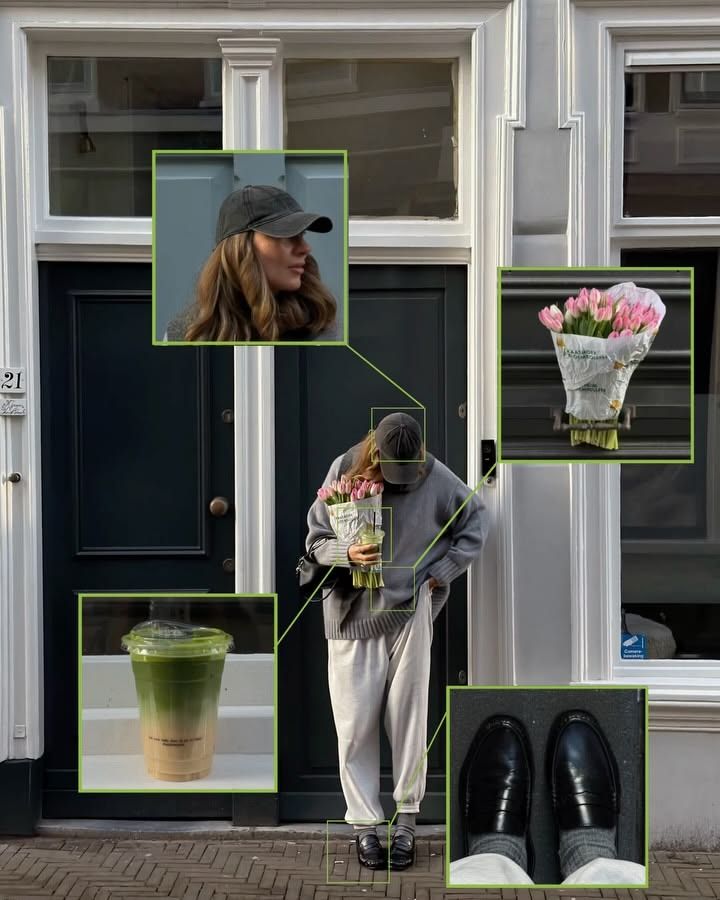
She buys a matcha every Tuesday. Not coffee, matcha, and not on Mondays or Wednesdays. She owns three pairs of vintage loafers and no sneakers. Twice a year she buys tulips, never roses, and she photographs them on the same windowsill. None of this is in your Shopify dashboard. All of it predicts what she does next.
This is a story about a customer who does not exist, assembled from patterns that absolutely do. She is a composite of the kind of buyer every brand in the 2 to 5 million range has and almost none of them can see. She is in your top 15%. She drives a slice of your revenue far larger than her order count suggests. And right now, on every dashboard you pay for, she looks exactly like everyone else who spent a similar amount last month.
That is the problem worth solving. Not that the data is missing. That the data is scattered, and scattered data hides the people who matter most.
The dashboard tells you what happened
Open your Shopify reports and you will learn what your customers bought. Open Klaviyo and you will learn what they opened. Open Meta and you will learn what they clicked. Each of these is true. Each of these is useful. And not one of them knows it is the same person.
This is the quiet failure at the center of most ecommerce stacks. The tools are good. The data is real. But every system holds one fragment of the customer and none of them holds the whole. Shopify sees the matcha order. It does not see that she only ever buys on Tuesdays, because it was never asked to look for rhythm. Klaviyo sees that she opens the Sunday newsletter and ignores the Friday one. Meta sees that she engages with the slow, quiet creative and scrolls past the loud sale posts. Three systems, three slivers, no synthesis.
The pattern that would tell you who she is does not live inside any single tool. It lives in the connection between them. And the connection is exactly the thing nobody is built to make.
Behavioral data versus the thing underneath it
Here is the distinction that runs through everything we do. Behavioral data tells you what happened. It is a record of the past, accurate and inert. She bought, she opened, she clicked. True, and already over.
Customer DNA is the layer underneath. It reads the why beneath the what. Not just that she bought matcha, but that she is the kind of person who builds small rituals and stays loyal to the brands that respect them. Not just that she buys tulips twice a year, but that she signals taste through restraint, choosing the quieter option on purpose. Values, identity, the lifestyle markers a person gives off without being asked. That is the signal. And it is the signal, not the spend, that predicts the next purchase.
A standard model would rank her by recency, frequency, and monetary value, the three numbers most platforms use to sort customers. RFM is a real and useful method. It is also blind to meaning. It will happily rank a one-time bargain hunter next to a devoted collector if their dollar totals match, and it will tell you to treat them the same. They are not the same. One will never come back. One would tattoo your logo on her forearm if you asked nicely.
How the synthesis actually works
We do not believe in black boxes, so here is the mechanism, plainly.
It begins with a CSV. A brand exports its customer order history from Shopify or WooCommerce and uploads it. That is the floor, not the ceiling. From there the system stitches in email engagement events, social audience signal, and transaction data from any connected commerce channel, until the three fragments become one profile per customer.
Then comes the part that matters. RFM scoring runs, but it runs weighted against psychographic signal. Instead of surfacing the 15% who spent the most last month, the model surfaces the 15% whose behavioral pattern matches the brand's actual worldview-driven cohorts. Those two groups overlap less than you would think. The biggest spender of last quarter might be a churn risk. The quiet repeat buyer with the specific ritual might be the most valuable customer you have, and she may never have triggered a single VIP alert.
The output is not a ranked list. It is a fingerprint. Three cohorts that describe who is already buying and what pattern unifies them, with one specific recommended next move. We are clear about what this is not. It is not a survey, not a focus group, not a prediction of net-new audiences you do not have data for yet. It describes the customers you already have, and it tells you the truth about which of them carry the brand.
Why this is worth getting right now
The math at your revenue size does not forgive guessing. At 50 million you can afford to be wrong ten times before you are right. At 2 to 5 million you get two or three shots, and paid acquisition keeps getting more expensive while attribution keeps getting blurrier. You do not get to A/B test your way to insight. You need to know the answer before you spend.
The asymmetry is the whole point. Across this revenue band, roughly 15% of customers drive somewhere between 40 and 60% of revenue, and once you fold in referrals and lifetime value, that same top slice often touches 70 to 80% of every outcome the brand cares about. The value is wildly concentrated. The attention almost never is. Acquisition budget gets spread evenly. Email goes out to everyone with the same words. Retention rewards a repeat purchase whether it came from a collector or a coupon.
The fix is not more data. You already have more data than you use. The fix is synthesis, the act of stacking the fragments until the person comes into focus, and then doing something different on Monday because of what you saw.
Back to the matcha
She was always there. The Tuesday rhythm, the loafers, the tulips on the windowsill. Every one of those is a data point, and read together they tell you not just what she will buy but how to speak to her when you do. The brand that sees only her order total will send her the same 20% off blast it sends everyone. The brand that reads the whole signal will send her the quiet, well-photographed thing she actually wants, at the moment she is most likely to want it.
One of those brands keeps her. The other one trains her to wait for the next discount and wonders why loyalty is so hard to buy.
Customer DNA is how you become the first brand. Not by collecting more about her, but by finally connecting what you already know.